As I’ve written, I’ve been creating a Mac app to create and manage this site, and I’ve been dogfooding it here for about a week. Because, of course there’s nothing better than using your own software day-to-day to find out exactly what needs to be done to make it better. I’m an experienced developer, but a relative novice at making Mac apps. I’ve been having places where the UI lags or hangs for a bit, and I’ve not used Instruments, Apple’s profiler, before. I asked Codex to walk me through how to troubleshoot these, and thought I’d write some notes in case it would help anyone else out (and I’m sure I’ll come back to these notes myself).
The general process is: initial set up of the build, running for profiling, recording a run of the behavior in question, and giving that run result to Codex (or whatever, including looking at it yourself, of course) to improve. Here’s more detail:
Setup
- In Xcode, select the scheme for your project.
- Go to Product -> Scheme -> Edit Scheme….
- Select Profile on the left.
- In Info, make sure Build Configuration is Release.
- Close the scheme editor.
- Save any work and quit any extra copies of the app.
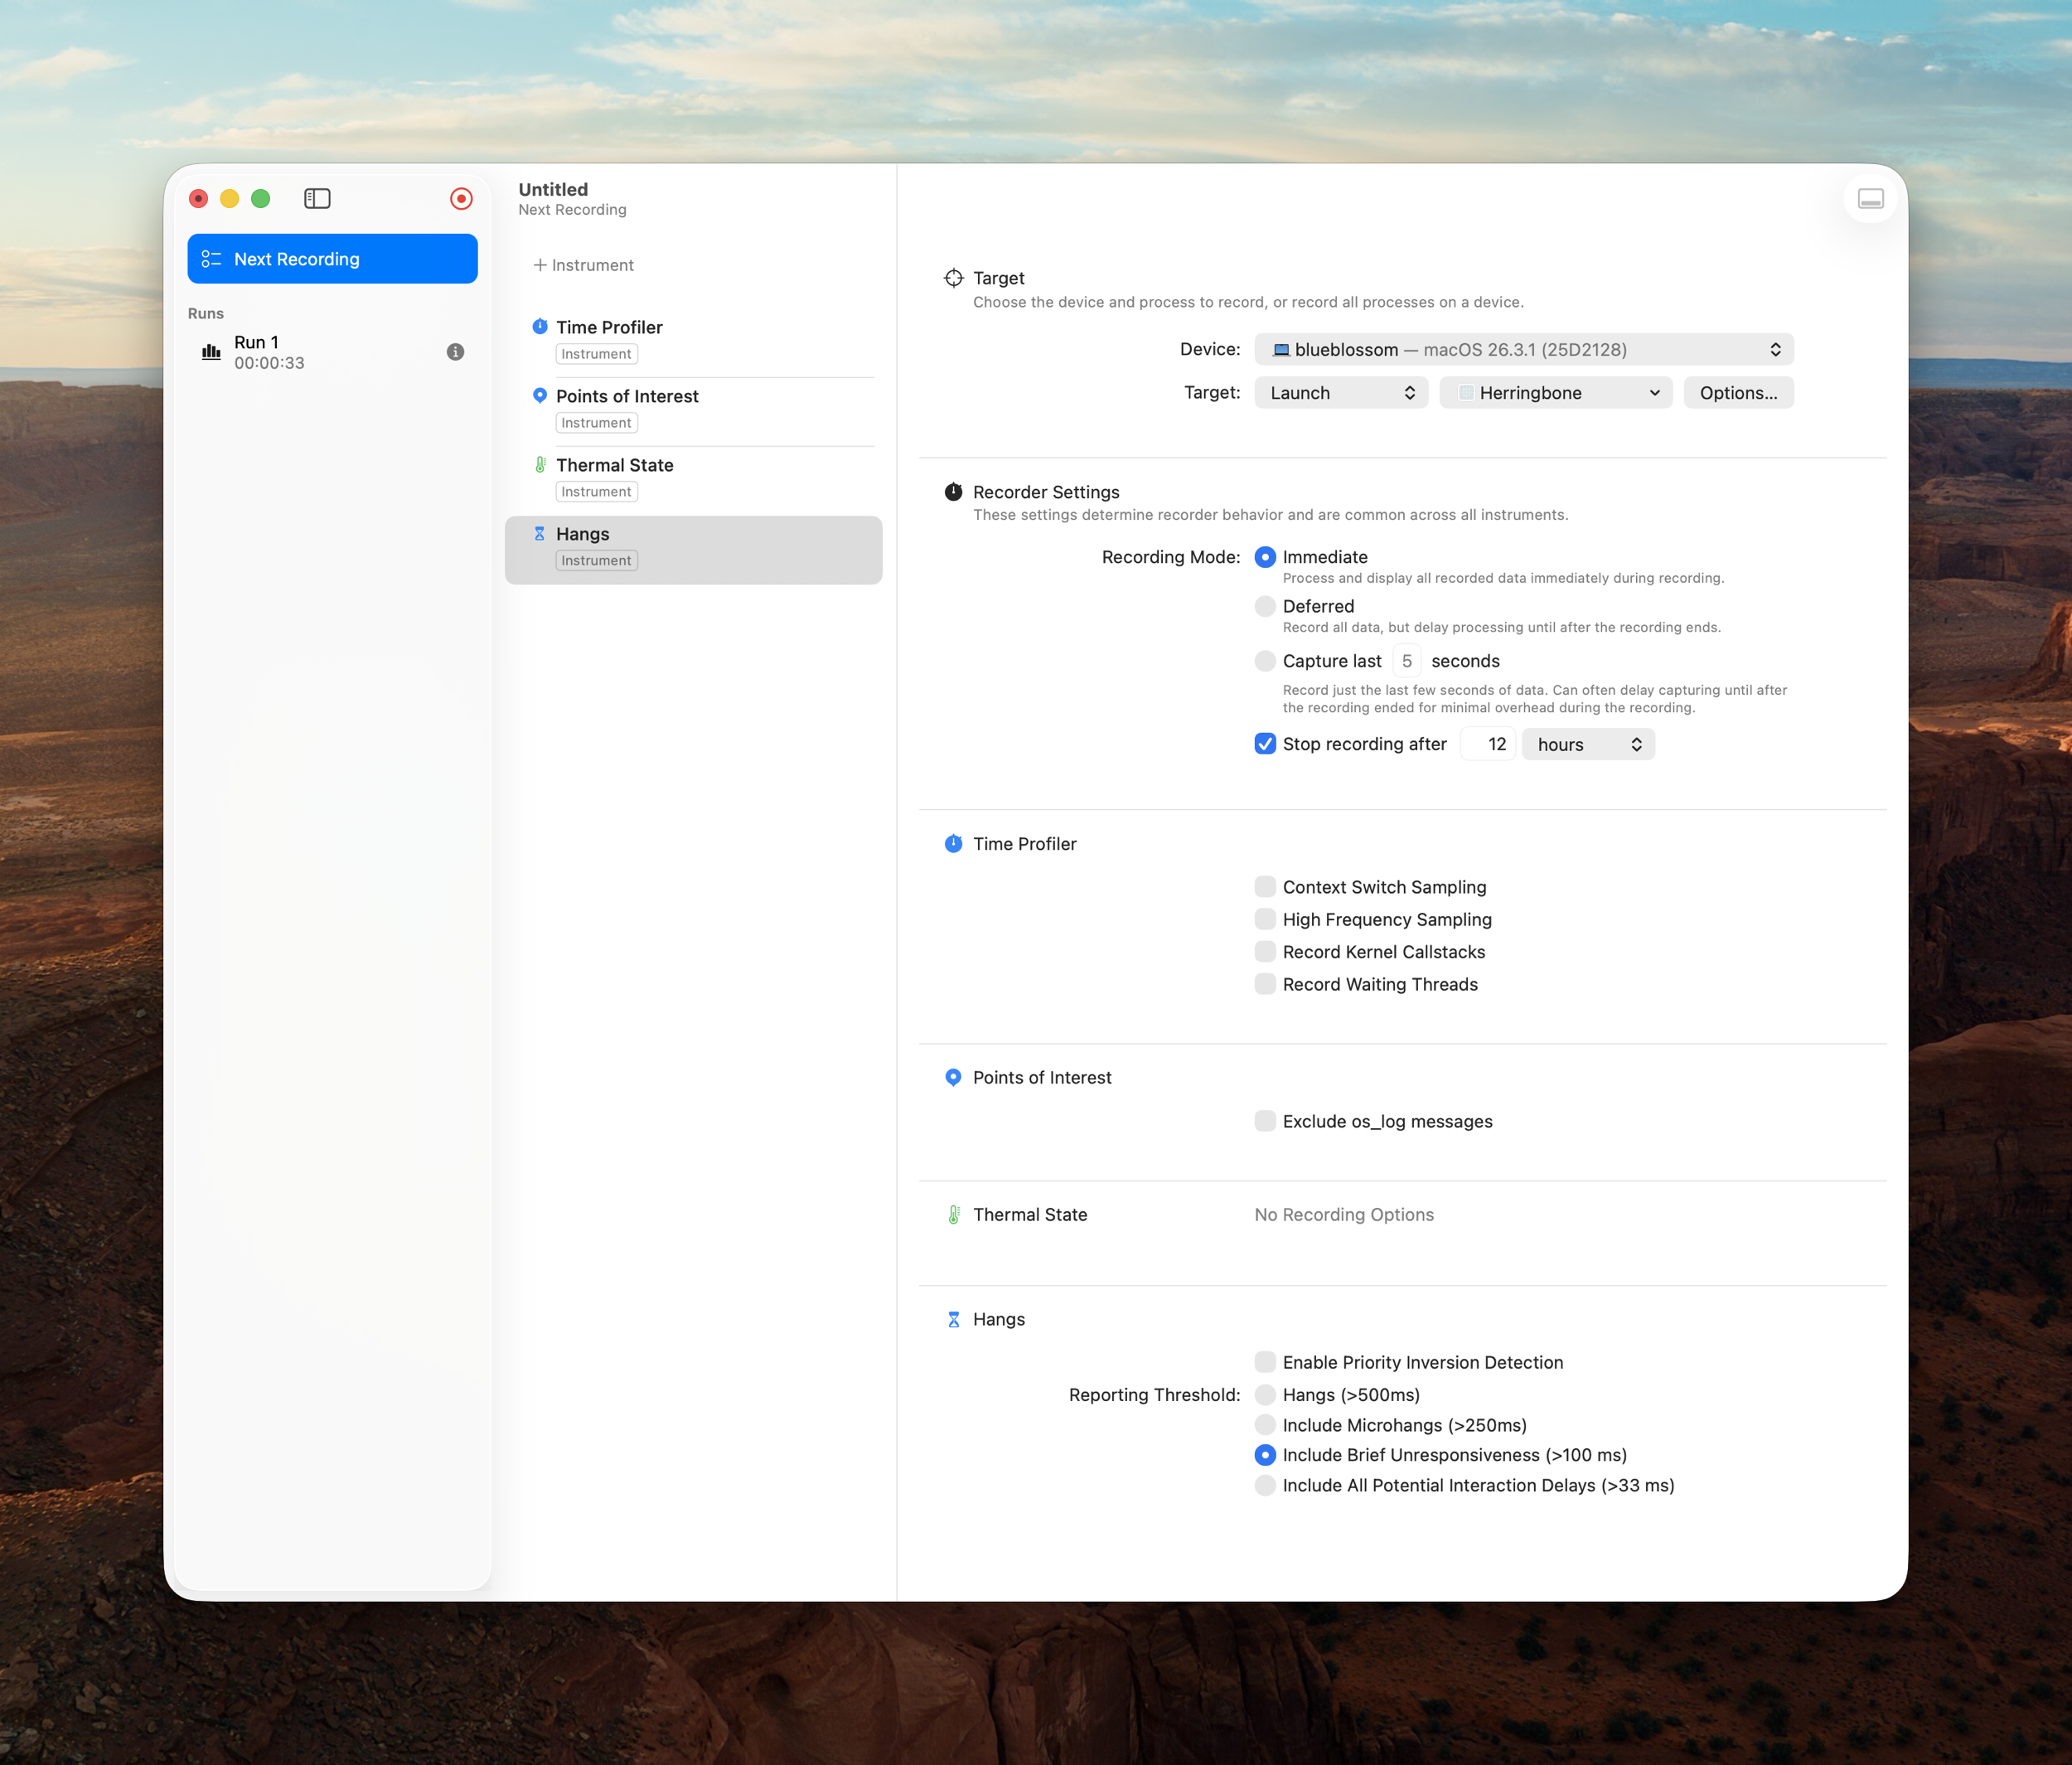
Start a Trace
- In Xcode, choose Product -> Profile.
- Instruments will open and show a template chooser.
- Pick Time Profiler.
- Click Choose.
- Click the red record button in Instruments.
- Instruments will launch your app.
- Reproduce the lag or hang behavior in your app.
- Stop recording.
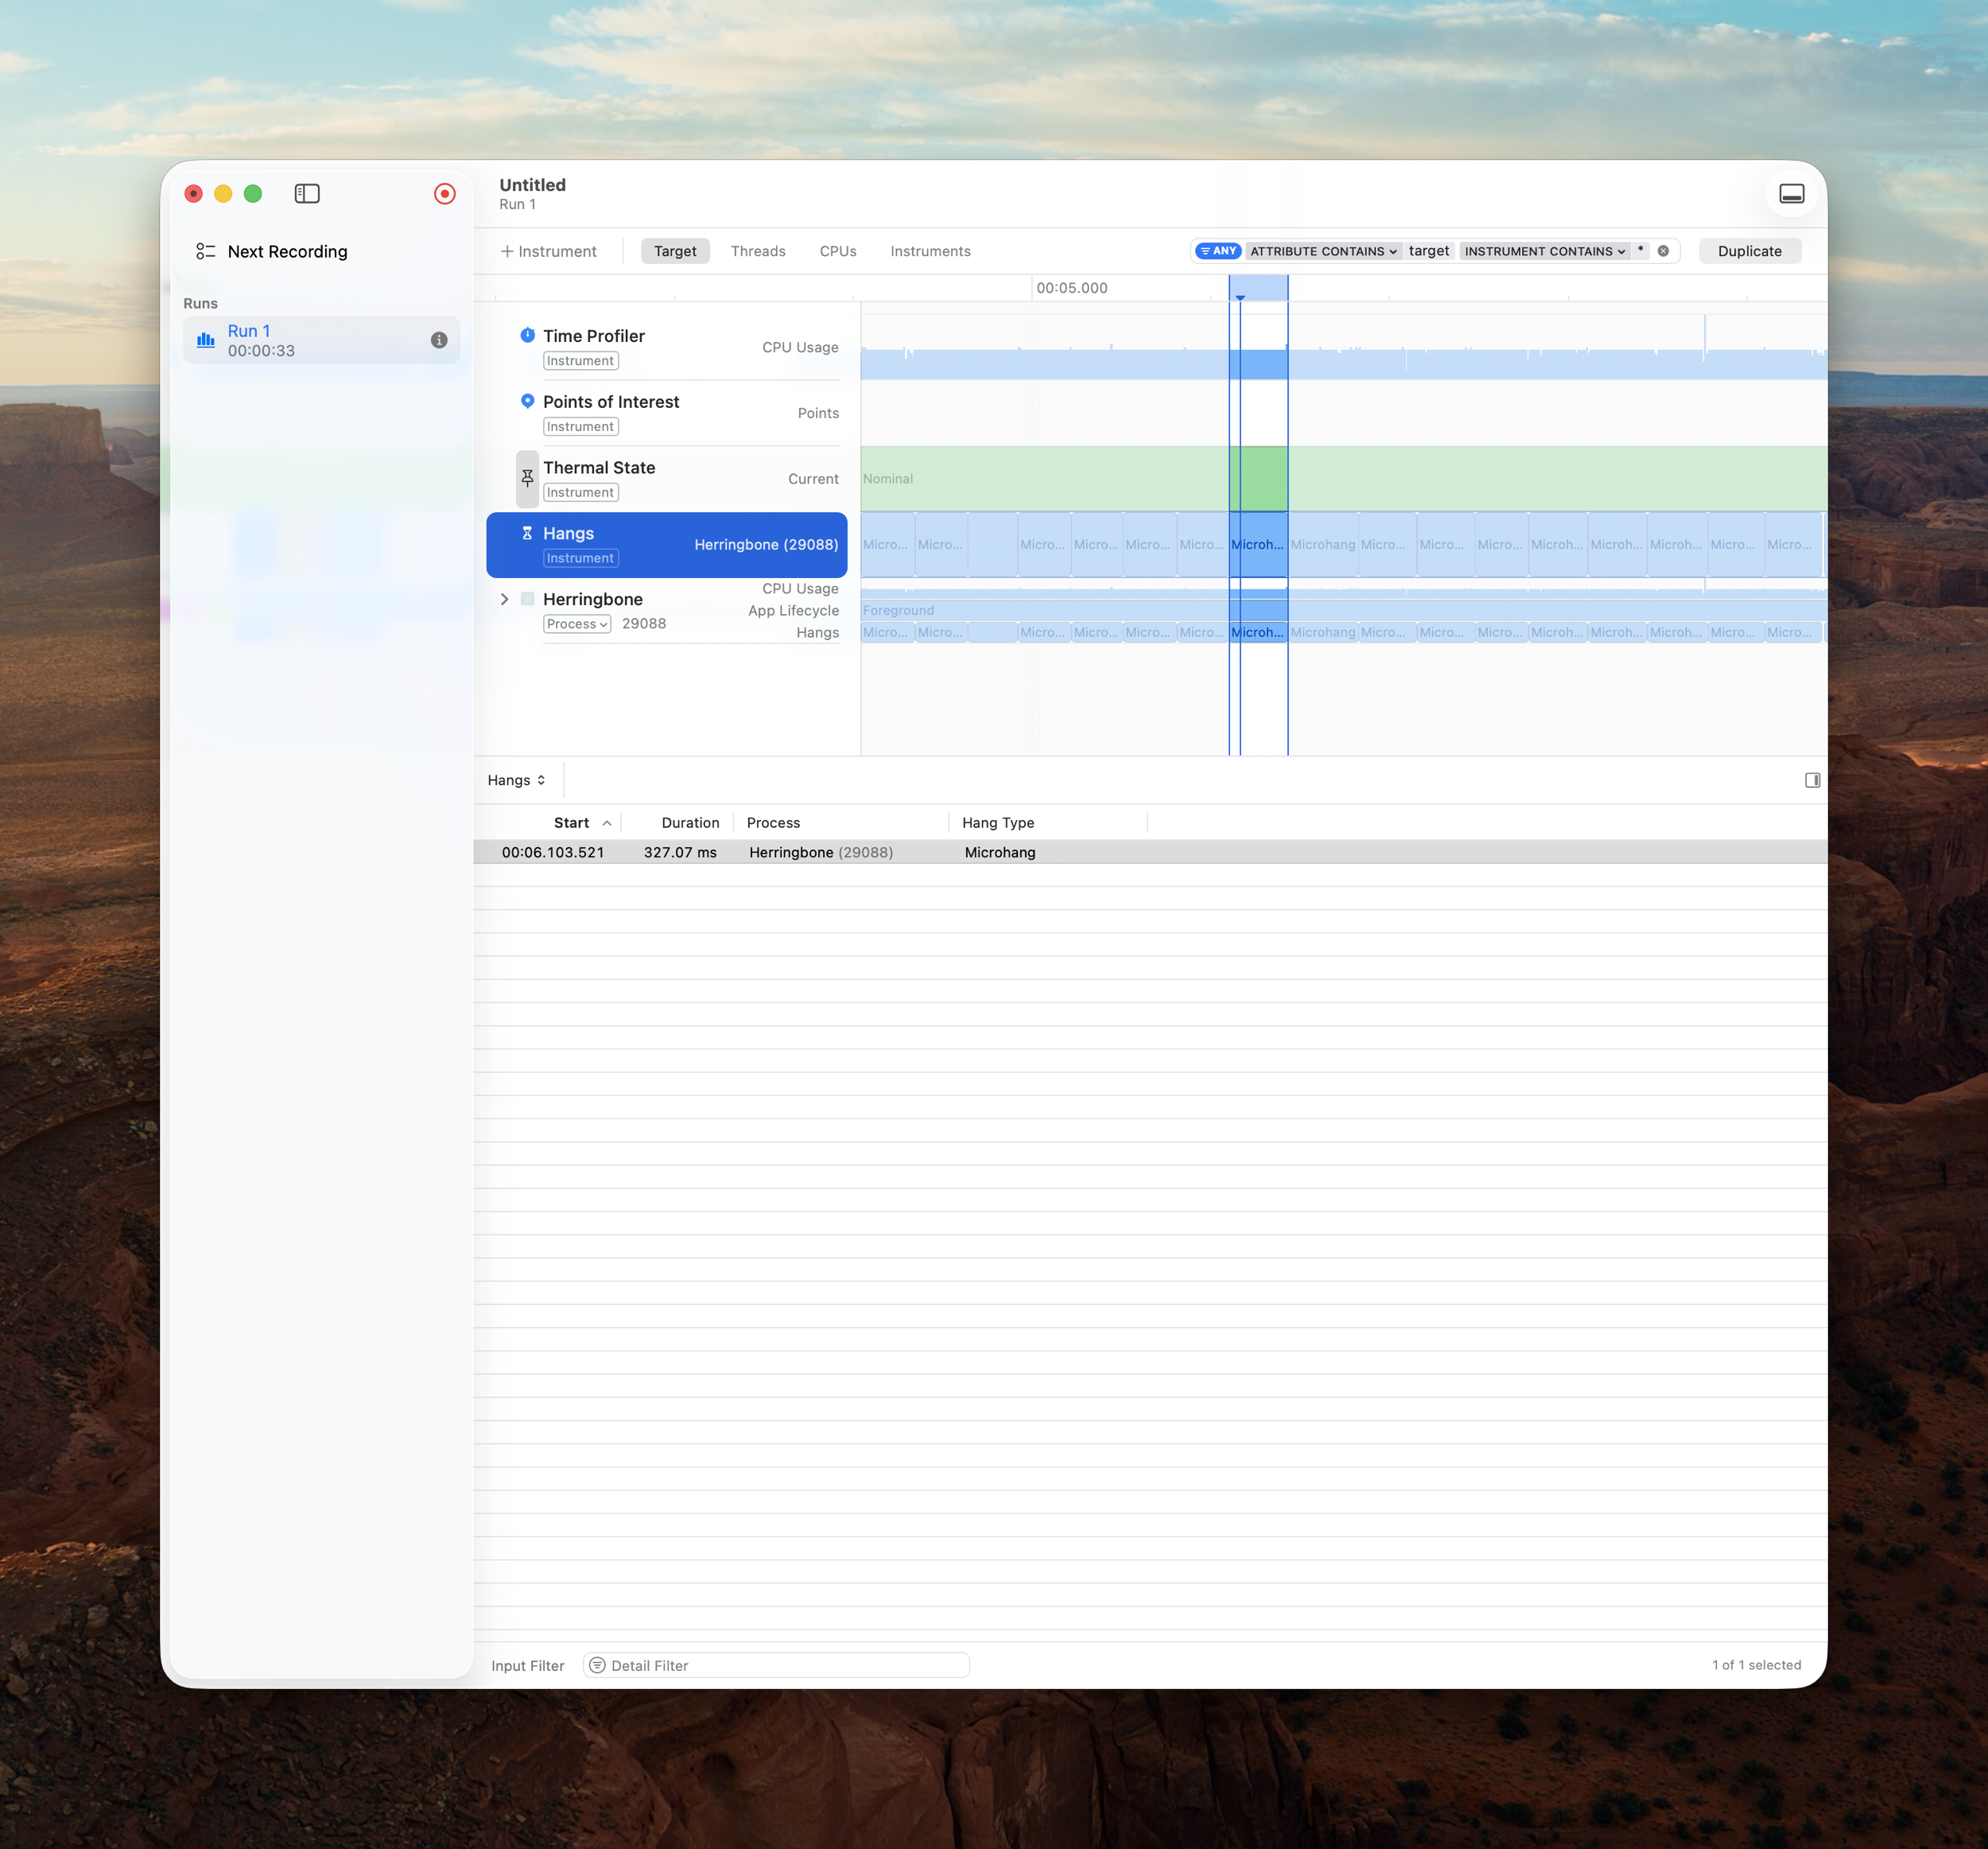
Read the Trace
- Optionally, use the Hangs track to identify Hangs by severity and focus on one, or a region.
- In the main Instruments window, click the Time Profiler track.
- Open the bottom pane if needed so you can see the call tree.
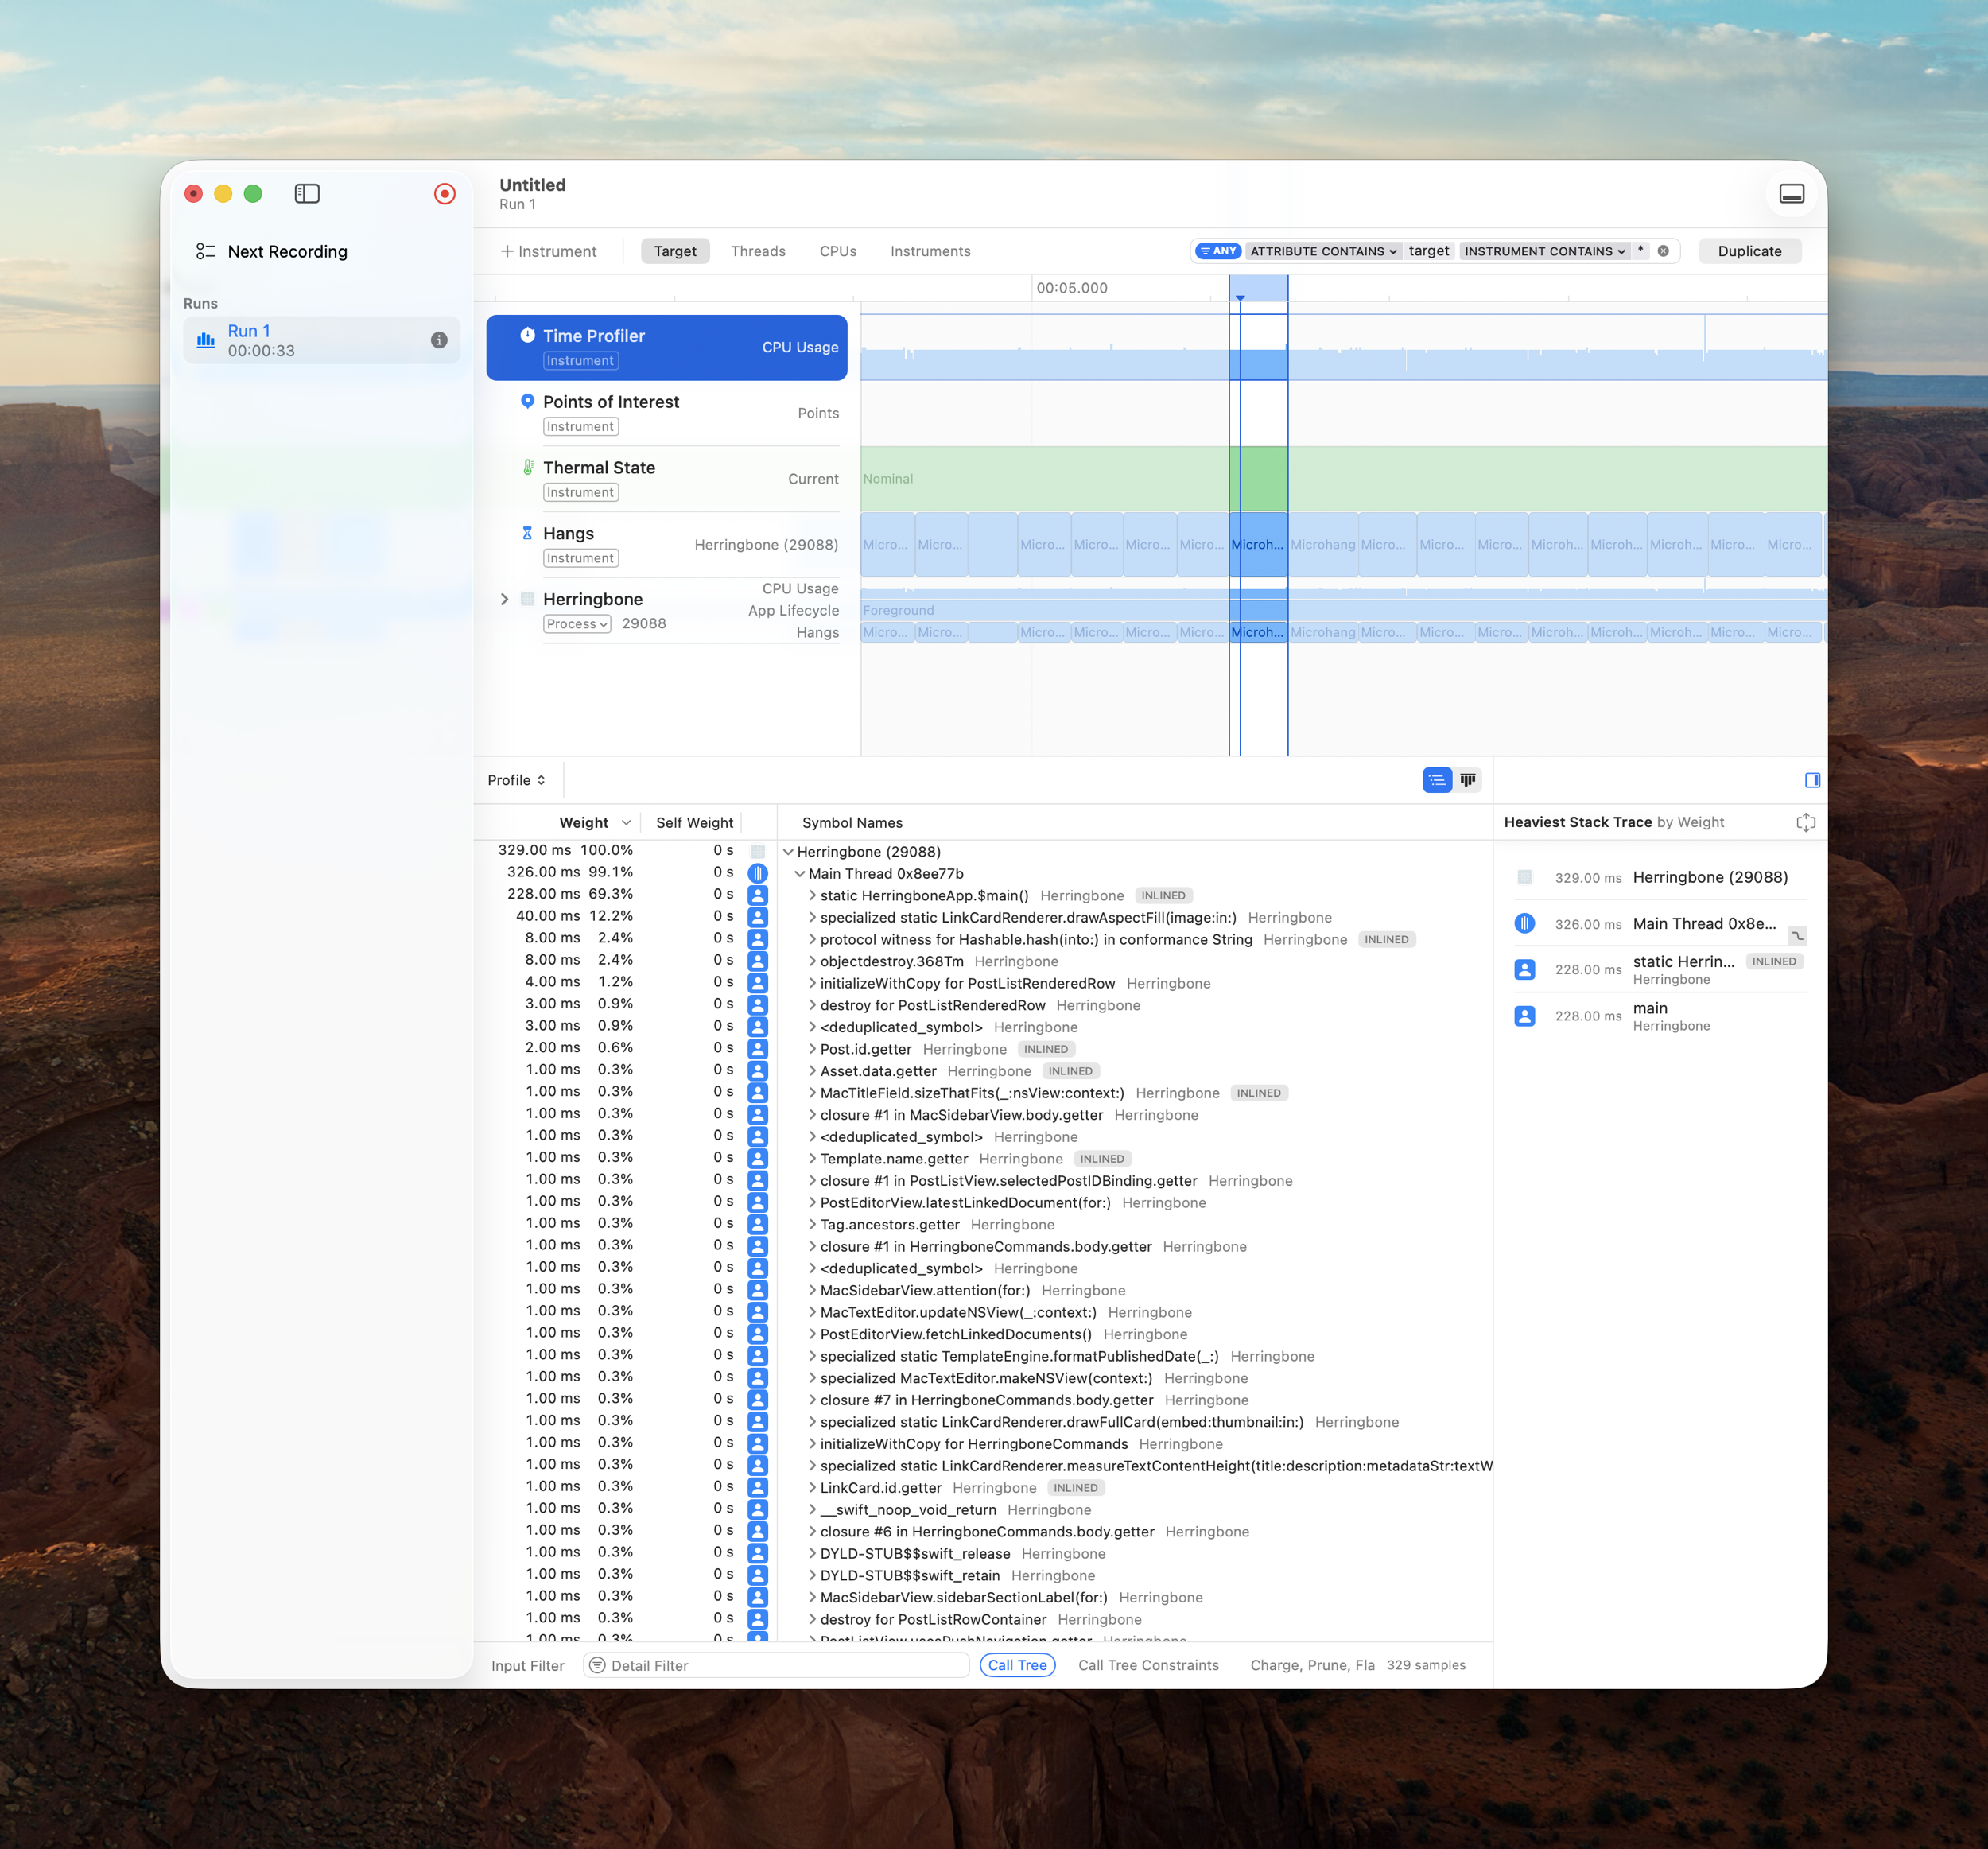
- Turn on these options in the call tree area:
- Invert Call Tree
- Hide System Libraries
- Separate by Thread
- Click the Main Thread row.
- Look at the hottest entries by Self Weight and Weight.
Round Trip With Your Favorite LLM
Or do it yourself, of course! In my case, I started giving screenshots of the Instruments window with the Main Thread row details revealed to Codex. Codex has been doing a great job of identifying and eliminating hangs, and getting the app feeling snappy again. I had one time where a session went through too many back-and-forths and I had to abandon and start over, but I’d learned enough from the first session to guide Codex more effectively the second time, and got to the bottom of the issue.
Conclusion
Doing this with me driving the loop is time consuming, but illustrative. I’ve learned from Codex as I’ve been driving Instruments and my app, closing in on the next hang or lag, one after another. It’s been a great way to get to the bottom of those things that make the difference between a frustrating interaction and a delightfully quick one.